Kamis, 10 November 2022

New Muni Metro Station Opens in the Heart of Union Square

New Muni Metro Station Opens in the Heart of Union Square
By Mariana Maguire

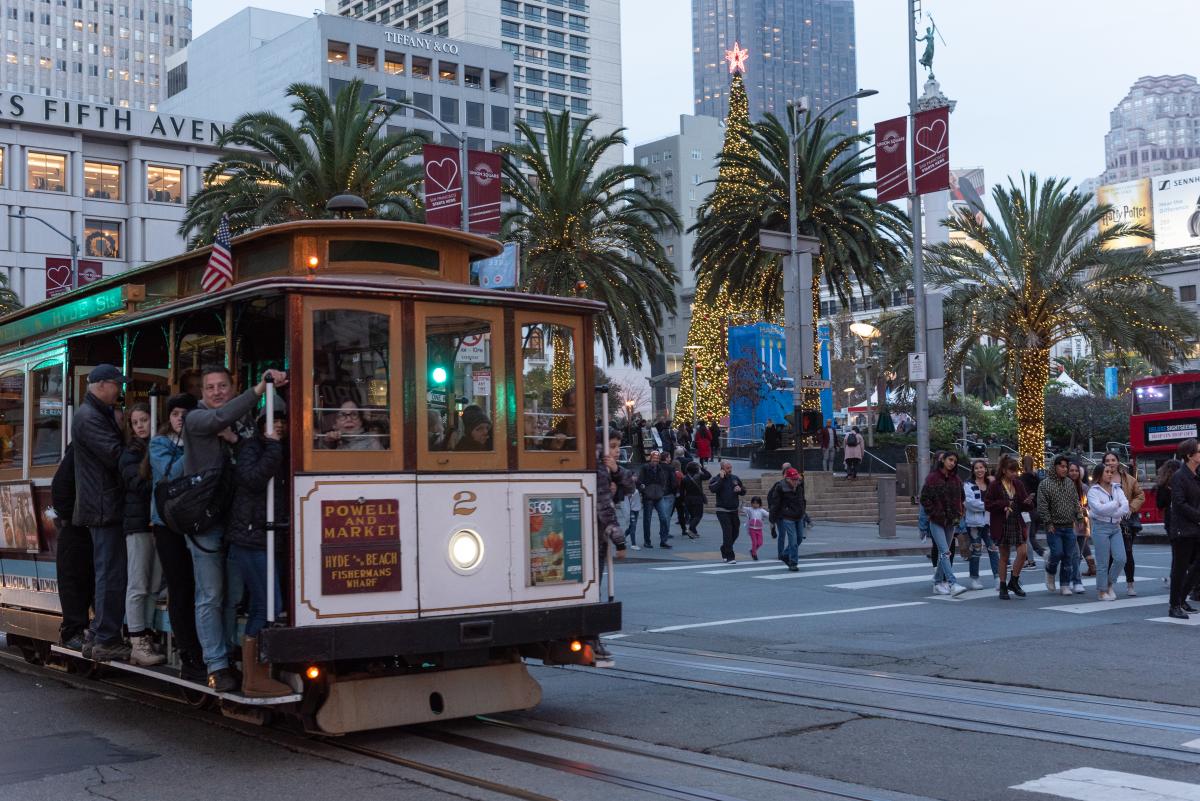
Photo of Union Square with holiday lights in the backgrouns, people crossing the street, and people riding a Cable car in the foreground.

Central Subway special weekend service will be running just in time for the holiday lights at Union Square

The new Central Subway Union Square/Market Street Station puts Muni customers in the heart of historic San Francisco, beneath Union Square Plaza at Geary and Stockton streets – open just in time to enjoy Macy’s famous holiday window displays and ice skating on the plaza.

Surrounding the Square, visitors can access world-class shopping from some of the most coveted names in fashion and jewelry. Travelers will be steps away from several big-name and boutique hotels. Quaint locally owned cafes, delis, restaurants and bars nearby offer a wide variety of cuisine from Asian to French to Irish, and beyond!

Barbary Coast Trail markers on the sidewalk will lead you on an odyssey through old San Francisco. Maiden Lane – a polite reference to the activities that once took place in the early days of the city – is now a stylish pedestrian promenade only half a block north of the new station entrance. Take a stroll and you’ll even see one of Frank Lloyd Wright’s buildings there.

Architecture buffs will find even more to explore around Union Square, where the skyline is sprinkled with Beaux-Arts, Chicago style, Art Deco, Futurist, modern and contemporary construction.

A short walk further north leads to the famous Chinatown Dragon Gates on Grant Street, marking the entrance to the neighborhood where San Francisco’s growth from tiny outpost to booming city began. Learn more about the destinations near Chinatown-Rose Pak Station..

Head to Powell Street, one block west of the Union Square/Market Street Station entrance and catch the Powell/Hyde or Powell/Mason Cable Car lines to ride America’s only moving National Monument! Read more about San Francisco’s cable cars and their unique history.
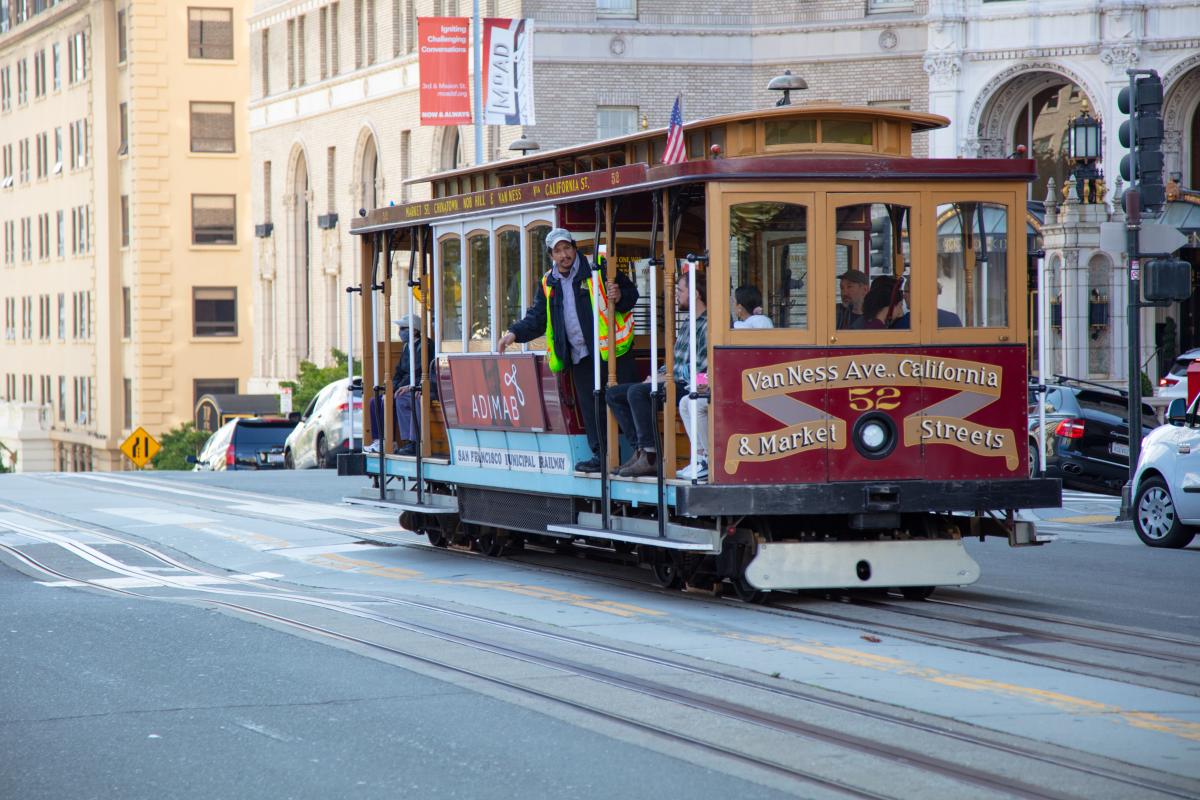
Cable car on a downtown street with a crew member hanging alongside

Historic cable cars run along Powell Street, next to Union Square.

Connect to Union Square when you hop on Central Subway’s special weekend service starting Saturdays and Sundays, November 19, from 8 a.m.-12 a.m.

T Third service between Chinatown-Rose Pak Station and Sunnydale starts January 7, 2023. Read more details on our service changes page.


Published November 10, 2022 at 03:32AM
https://ift.tt/RzQdLu1

Show HN: Open-source load testing on AWS Lambda. With built-in cost reporting https://ift.tt/Y0J4fyo

Show HN: Open-source load testing on AWS Lambda. With built-in cost reporting Hiya HN! tldr: Artillery is an open-source load testing toolkit. It's cloud-native, i.e. you can scale out your test with AWS Lambda (other runtimes coming soon). There's no infra to set up or manage - you give Artillery an AWS account, and it takes care of the rest. We just released an update which includes cost reporting. Every time you run a load test, Artillery will show how much that cost in AWS Lambda fees. Blog post with a demo here: https://ift.tt/Majf0rW The demo shows a distributed load test running in us-east-1 at 100k+ RPS for about 10 minutes. Total cost is $1.23. We constantly hear from our users how cost is one of the biggest barriers to load testing more frequently. We're making cost much less of a factor with Artillery, and hoping that will unlock load testing at scale to more teams. Would love to hear what the biggest barriers are for you with load testing! Hassy & team Artillery November 9, 2022 at 11:18PM

Rabu, 09 November 2022

Show HN: XFrame – Create your own multisearch page https://ift.tt/YH32qcr

Show HN: XFrame – Create your own multisearch page https://ift.tt/lodEeNn November 9, 2022 at 06:20PM

Show HN: Brainpick.co.uk – Earn money by answering StackOverflow questions https://ift.tt/ioHeDzj

Show HN: Brainpick.co.uk – Earn money by answering StackOverflow questions Hi! I am looking for honest feedback on my next product. Brainpick.co.uk is a Chrome extension that adds a button on StackOverflow standard page to pay for an answer. You answer and get paid when the answer is accepted. I am selling it to Enterprises as an affordable, subscription-based, pay-as-you-go service. Let me know your thoughts. https://ift.tt/BJZackH November 9, 2022 at 03:54PM

Show HN: Build a Better Software Developer Resume https://ift.tt/S5ky8iK

Show HN: Build a Better Software Developer Resume After about 10 years as a developer, interviewing many devs, and reviewing hundreds of resumes I decided to write a guide that I wish I had when I was first starting out. Completely free (just enter $0 as price) If you find it helpful, would love it if you: - Leave a review - Share it with a friend who might also benefit! https://ift.tt/Hisd5F8 November 9, 2022 at 06:50AM

Show HN: Helping laid-off people find their next job https://ift.tt/kQLKnzs

Show HN: Helping laid-off people find their next job https://ift.tt/dE65kGc November 9, 2022 at 12:12AM

Show HN: Pet Portrait AI – Custom Pet Portraits https://ift.tt/5eADK8P

Show HN: Pet Portrait AI – Custom Pet Portraits https://petportrait.ai/ November 9, 2022 at 01:56AM

Show HN: Twofer Goofer – rhyming daily word game made with Midjourney https://ift.tt/Oeibnc3

Show HN: Twofer Goofer – rhyming daily word game made with Midjourney https://ift.tt/wHneB1q November 9, 2022 at 12:14AM

Selasa, 08 November 2022

Show HN: Slashbase – open-source collaborative IDE for databases in browser https://ift.tt/Zd6hXHG

Show HN: Slashbase – open-source collaborative IDE for databases in browser https://ift.tt/CzWvXgq November 8, 2022 at 01:45PM

Five Years of Data Show: Our Street Safety Projects are Making a Difference

Five Years of Data Show: Our Street Safety Projects are Making a Difference
By Julia Malmo

Ever wonder about the effectiveness of projects after they go into the ground? Us, too!  

That’s why, in 2017, we launched the Safe Streets Evaluation Program to help project teams understand whether a transportation safety project’s design is effective, and where there might be opportunities to adjust the design if not. Project evaluation data can also be combined across projects to help the SFMTA track the effectiveness of a certain type of safety improvement, which can in turn streamline the design of future projects. The Safe Streets Evaluation Program helps us work towards achieving Vision Zero, an initiative to prioritize street safety and eliminate traffic deaths in San Francisco.  

This week, we’re looking back on five years of data gathered through our Safe Streets Evaluation Program with the “2022 Safe Streets Evaluation Summary,” an interactive website summarizing the results of 18 bicycle, pedestrian and traffic safety projects implemented since 2017. 

Each of the 18 projects evaluated in the summary report added significant safety upgrades to the streets. Some introduced vehicle travel lane removals (road diets), separated bikeways, separated bike signals, or left-turn traffic calming devices. Others brought general improvements for pedestrians at intersections including pedestrian signal improvements, daylighting (red zones at intersections) and upgraded crosswalks. For every project, the SFMTA drew on a wide range of data—from project-specific observations, to police reports, to speed data—to create a comprehensive view into its’ effectiveness. 

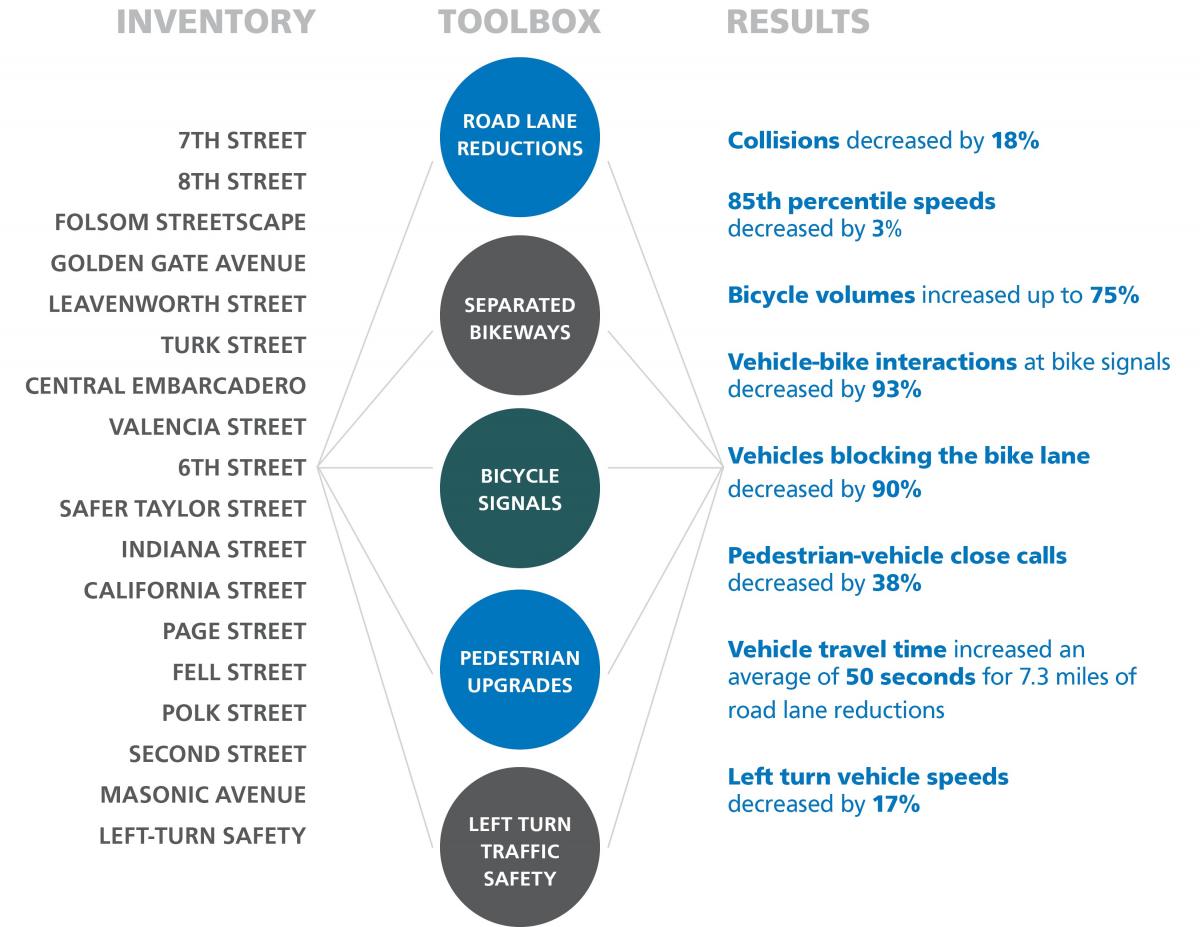
An infographic displaying the project names, key design element, and results. In the lefthand column, under “Inventory” the following projects are listed: 7th Street, 8th Street, Folsom Streetscape, Golden Gate Avenue, Leavenworth Street, Turk Street, Central Embarcadero, Valencia Street, 6th Street, Safer Taylor Street, Indiana Street, California Street, Page Street, Fell Street, Polk Street, Second Street, Masonic Avenue, Left-Turn Safety. In the center column, under “toolbox,” the following elements are listed: Road lane reductions, separated bikeways, bike signals, pedestrian upgrades, left-turn traffic safety. In the righthand column, under “results”, the following findings are listed: Collisions decreased by 18%; 85th percentile speeds decreased by 3%; bicycle volumes increased up to 75%; vehicle-bike interactions at signals decreased by 93%; vehicles blocking the bike lane decreased by 90%; pedestrian-vehicle close calls decreased by 38%; vehicle travel time increased an average of 50 seconds for 7.3 miles of road lane reductions; left turn vehicle speeds decreased by 17%

The evaluation report indicates that the SFMTA’s safety tools are working together to create safer environments for all modes of transportation on city streets. 

You can dig into the whole set of outcomes on the website, but here are some highlights:  

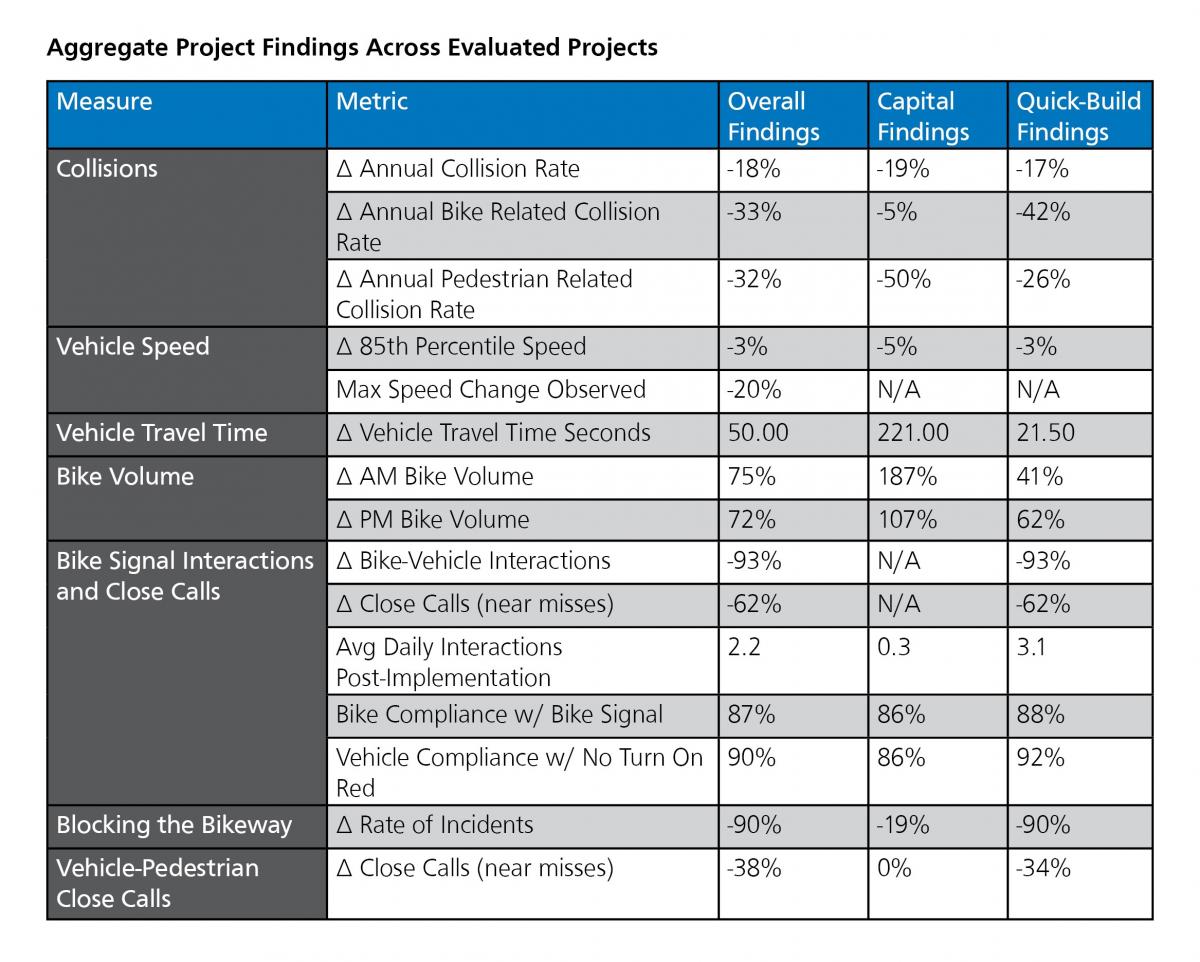
  • Within the projects evaluated, annual collision rates decreased by 18%  

  • Bicycle-related collision rates decreased by 33% and pedestrian-related collision rates decreased by 32%   

  • Bicycle volumes on streets that received bicycle improvements increased up to 75% in the morning peak (8 AM to 10 AM) commute times, with similar growth in the afternoon/evening peak (4 PM to 6 PM) commute times.   

  • Thanks to protected bikeways, the rate of incidents of vehicles blocking the bike lane decreased by 90%.   

  • Close calls or near misses between pedestrians and drivers decreased across evaluated projects by 38%.  

  • Several projects in under-served communities such as the Bayview and Tenderloin are helping to address historic inequities and under-investment in these neighborhoods.   A table titled “Aggregate Project Findings Across Evaluated Projects”. At the top of the table, a blue bar lists out the column titles: Measure; Metric; Overall Findings; Capital Findings; Quick-Build Findings. In the Collisions section, the following sub-categories are evaluated. For Annual Collision Rate: Overall findings show an 18% reduction; Capital Findings show a 19% reduction; Quick-Build Findings show a 17% reduction. For Annual Bike-related collision rate: Overall findings show a 33% reduction; Capital findings show a 5% reduction; Quick-Build findings show a 42% reduction. For Annual Pedestrian Related Collision Rates: Overall findings show a 32% reduction; Capital findings show a 50% reduction; Quick-Build findings show a 26% reduction. In the Vehicle Speed section, the following sub-categories are evaluated. For 85th Percentile Speed: Overall findings show a 3% reduction; Capital findings show a 5% reduction, and Quick-Build Findings show a 3% reduction. For Max Speed Change Observed: Overall findings show a 20% reduction, and no data is present for either Capital Findings or Quick-Build Findings. For Vehicle Travel Time/Vehicle Travel Time in Seconds: Overall findings show 50.00; Capital Findings show 221.00; Quick-Build Findings show 21.50. For the Bike Volume section, the following sub-categories are evaluated. For AM Bike Volumes: Overall Findings show a 75% increase; Capital Findings show a 187% increase; Quick-Build findings show a 41% increase. For PM Bike Volumes: Overall Findings show a 72% increase; Capital Findings show a 107% increase; Quick-Build Findings show a 62% increase. In the Bike Signal Interactions and Close Calls section, the following sub-categories are evaluated. For Bike-Vehicle interactions: Overall findings show a 93% reduction; Capital findings show no data; Quick-Build findings show a 93% reduction. For Close Calls (near misses): Overall findings show a 62% reduction; Capital findings show no data; Quick-Build findings show a 62% reduction. For Average Daily Interactions Post-Implementation: Overall Findings show 2.2; Capital Findings show 0.3; Quick-Build Findings show 3.1. For Bike Compliance w/ Bike Signal: Overall findings show 87% compliance; Capital Findings show 86%; Quick-Build Findings show 88% compliance. For Vehicle Compliance w/ No Turn On Red: Overall findings show 90% compliance; Capital Findings show 86% compliance; Quick-Build findings show 92% compliance. In the Blocking the Bikeway section, Rates of Incidents was evaluated. Overall Findings show a 90% reduction; Capital Findings show a 19% reduction; Quick-Build Findings show a 90% reduction. In the Vehicle-Pedestrian Close Calls Section, Close Calls (near misses) were evaluatd. Overall Findings show a 38% reduction; capital findings show a 0% reduction; quick-build findings show a 34% reduction

The Safe Streets Evaluation team will continue to think creatively about how to build on the evaluation work and use it to inform our current and future projects, programs, and practices through developing a publicly accessible database of all Safe Streets Evaluation data and finding better ways to evaluate project outreach efforts. 

View the 2022 Safe Streets Evaluation Summary 

Learn more about the SFMTA Safe Streets Evaluation Program: SFMTA.com\safestreetsevaluation 


Published November 08, 2022 at 05:56AM
https://ift.tt/0yU2nLm